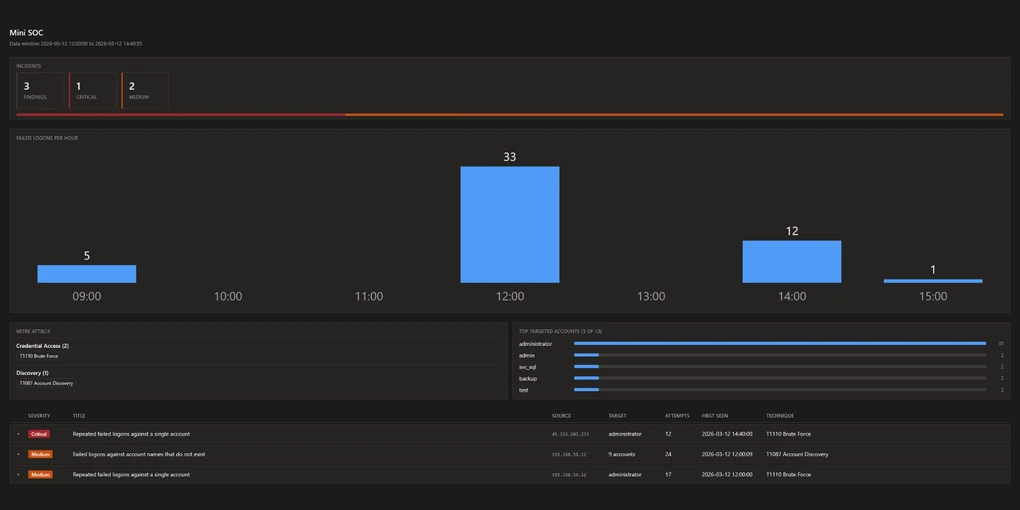
Mini SOC: Code Finds Password Attacks, a Local LLM Judges
Windows writes a line to its security log every time a sign-in fails. One line means nothing. People mistype their passwords. Seventeen of them against the same account inside seventy-six seconds is a program, not a person.
Nothing in the log says “attack”. There are seventeen lines that look alike. Someone has to count them and see the shape before there is anything to report.
My Mini SOC does that counting. It reads Windows logon logs, groups the failures that belong together, scores how serious each group is, and has a language model on my own machine write a short assessment. The output is a dashboard you open in a browser.
Why I built it
Two reasons. I wanted to understand how detection on log data works in practice. And I wanted to build something with a language model in it where the model has a defined job.
The second reason shaped the whole design. Throwing a dataset at a model and getting a plausible answer back is not hard. Deciding which part of the work belongs to the model, and which part it should never touch, is the real problem.
How it works
Five stages, each doing one thing:
collect -> detect -> enrich -> agent -> dashboardcollect supplies the raw data: Windows events 4624 (successful sign-in) and 4625 (failed).
detect correlates. Windows records single events, never attacks, so this is where a finding is born.
enrich adds what the log line leaves out: that logon type 10 is an RDP session, that
status code 0xC000006A means the account exists and the password was wrong, that an
address sits outside the local network. It also assigns a severity from 1 to 5.
agent sends the finished finding to a local model, Qwen2.5 32B running under Ollama.
dashboard writes a single HTML file.
There is no third-party library anywhere in it. Python and its standard library are enough. No account, no API key, and nothing leaves the machine.
Detection
Rule 1: one account, many attempts
Five or more failures from one source against one account within five minutes. This is classic password guessing.
It has a blind spot. An attacker who tries a hundred accounts twice each instead of one account a hundred times will never trigger it.
Rule 2: one source, many accounts
One source failing against four or more distinct accounts within ten minutes. Rule 2 counts accounts where rule 1 counts attempts, which is what makes the second attacker visible.
Telling the two techniques apart
Rule 2 detects a pattern, and two different attacks produce that pattern.
Password spraying: the attacker holds a list of real account names and tries one common password against all of them. Few attempts per account, so no lockout triggers.
Account discovery: the attacker has no account names and is guessing them.
From the outside these look the same. The failure code separates them. A spray works from a list of accounts the attacker believes exist, so it can never produce a “no such user” failure. If that code appears, names are being guessed.
The MITRE technique is therefore not hardcoded per rule. The data decides it.
The dataset is the test
I did not write unit tests. Instead collect.py generates the same 61-event dataset
from a fixed seed on every run. Since the correct answer is known before the run, any
deviation shows up immediately, and for a project this size that has served me better
than a test suite would have.
The data is built to be difficult in three specific ways.
Typos with the same signature as the attack. The harmless failures carry the same event ID and the same failure code as the real attack. Filtering by event type cannot separate them. Only density per source can.
Two events just outside the window. Next to the burst of 17 attempts sit two more from the same source against the same account, hours before and after it. Anything that groups without correlating in time reports 19 instead of 17. If the output says 19, the window logic is broken.
A sweep below every individual threshold. Eight non-existent account names, each tried exactly twice. Every one of them sits far below the brute-force threshold, so rule 1 reports none of it. Rule 2 exists because of this case.
What the model does
What stays in code
Counting, arithmetic and lookups all happen before the prompt runs. Attempt counts, timestamps, the severity score with its reasons, the MITRE mapping: the model receives all of it as settled fact. The prompt tells it never to recompute any of that, and never to name a technique that is not in the finding.
A model asked to recompute a number sometimes gets it wrong, and writes the wrong one down as confidently as the right one.
What the model is asked for
The questions no threshold can answer. What is this most likely? How sure can we be? What can the data not tell us? What do you do first?
Example output
This is the real reply for the most severe finding:
ASSESSMENT: The finding indicates a "Brute Force" attack as per MITRE, with 12
failed logon attempts against the "administrator" account from a single public IP
address within a short duration.

CONFIDENCE: high - the repeated failed logon attempts against a single privileged
account from a public IP address within a short timeframe.

UNKNOWNS:
- The intent behind the brute force attempt -> Investigate the source IP for any
  known malicious activity or previous incidents.

ACTIONS:
1. Block the source IP address (45.155.205.233) to prevent further unauthorized
   access attempts [source_ip, ip_scope].
2. Review the RDP logs for any successful logon attempts from the source IP
   address during the same timeframe [source_ip, first_seen, last_seen].
The square brackets are required by the prompt. Each action has to name the fields of the finding it follows from, which makes it checkable later whether a recommendation came out of the data or out of thin air.
Results
The pipeline finds three incidents in the bundled dataset:
| Severity | Type | Source | Scale | MITRE |
|---|---|---|---|---|
| 5 | Brute force | 45.155.205.233 (external) | 12 attempts in 55 s | T1110 |
| 3 | Account discovery | 192.168.56.12 (internal) | 9 accounts, 24 attempts | T1087 |
| 3 | Brute force | 192.168.56.12 (internal) | 17 attempts in 76 s | T1110 |
The middle row needs explaining. The sweep tries eight names twice each, which is 16 attempts against 8 accounts, so where do 24 and 9 come from?
Rule 2 works on a ten-minute window and picks the one holding the most distinct
accounts. That window slides back into the burst and picks up 15 attempts against
administrator, which buys it a ninth account. It pays for them: the window now ends
before the sweep does and misses 7 of its 16 attempts. So 24 is 15 borrowed from the
burst plus 9 of the sweep’s own, and the rule maximised the wrong number to get there.
More on that below.
The timeline in the dashboard makes the shape of the day clearest. There are 33 failures in the hour the internal attack runs, and none at all in the two hours before it. No table row shows that.
Known limits
Writing this list was uncomfortable, and it taught me more than building the features did. You can only write down the limits you have understood.
No success signal. Detection discards every successful sign-in and looks only at failures. Whether any of the attempts worked is the most useful thing the system cannot tell you. This is the biggest gap.
The sweep window borrows events. Rule 2 picks the widest window by account count, so
it also collects whatever else that source was doing at the time. In the bundled data
that is the 15 administrator attempts explained above, which the brute-force rule
already reports as a finding of its own.
One number with two meanings. The attempt count is compared against a single threshold, but it means different things per rule. 17 attempts against one account is persistence. The sweep’s own 16 attempts are exactly two per account, which is what keeps it under the lockout threshold. A rate would separate them: 13.4 failures per minute for the burst against 3.9 for the sweep.
Those are the sweep’s real numbers, not the finding’s. The finding would give 2.4 per minute, because the borrowed events stretch its window to 596 seconds. The contaminated figure makes the gap look wider than it is, which is a good reminder that a number is only as good as the window it was measured over.
The model’s output is not checked. Every action has to end with the finding fields
it follows from, like the [source_ip, ip_scope] in the example above. Nothing verifies
that those fields exist, or that they support the action. One run put
[first_seen, last_seen] behind “conduct a forensic analysis of the RDP session logs”,
which are simply two fields that happen to be there.
What comes next
Forcing the model’s reply through a JSON schema instead of parsing free text. Then the field names arrive as a list rather than as text in square brackets, and checking them against the finding becomes one line of code.
The code is at github.com/DilaraKoc1/mini-soc.